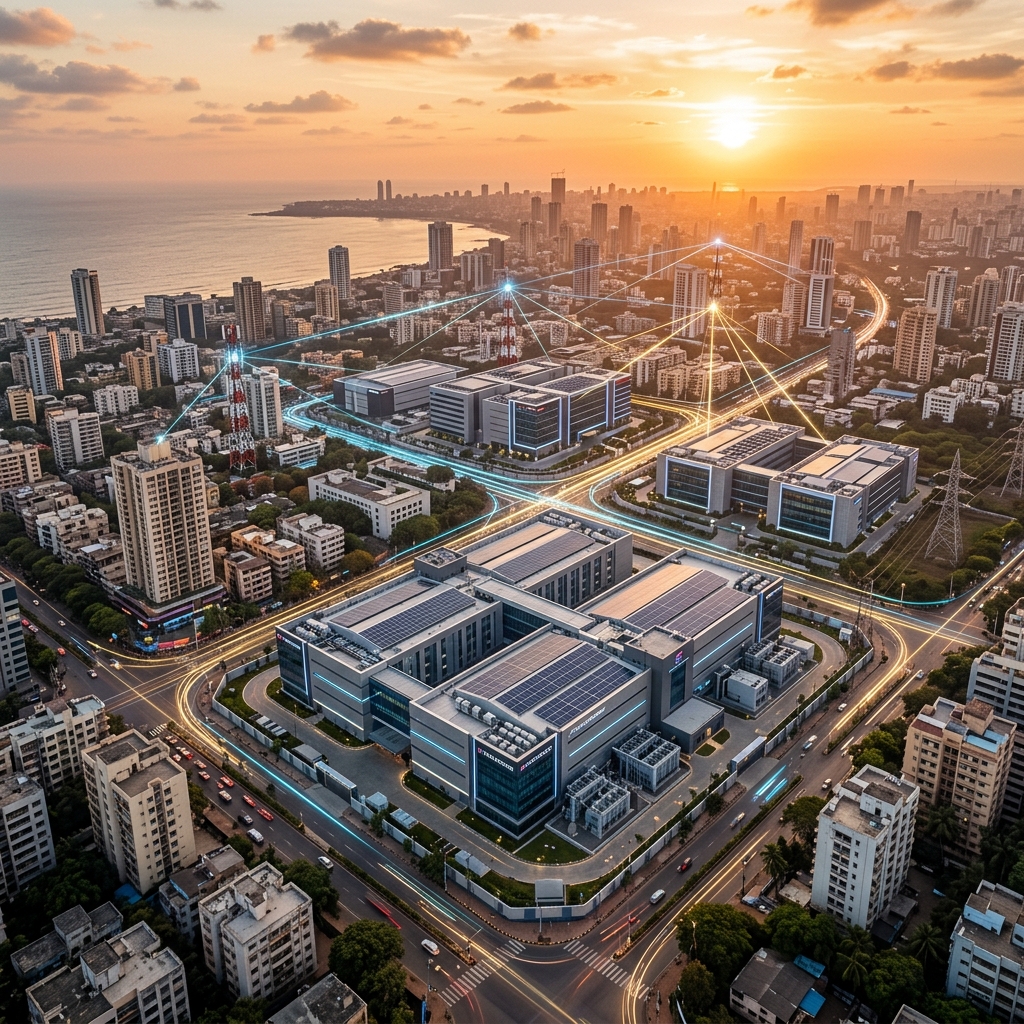

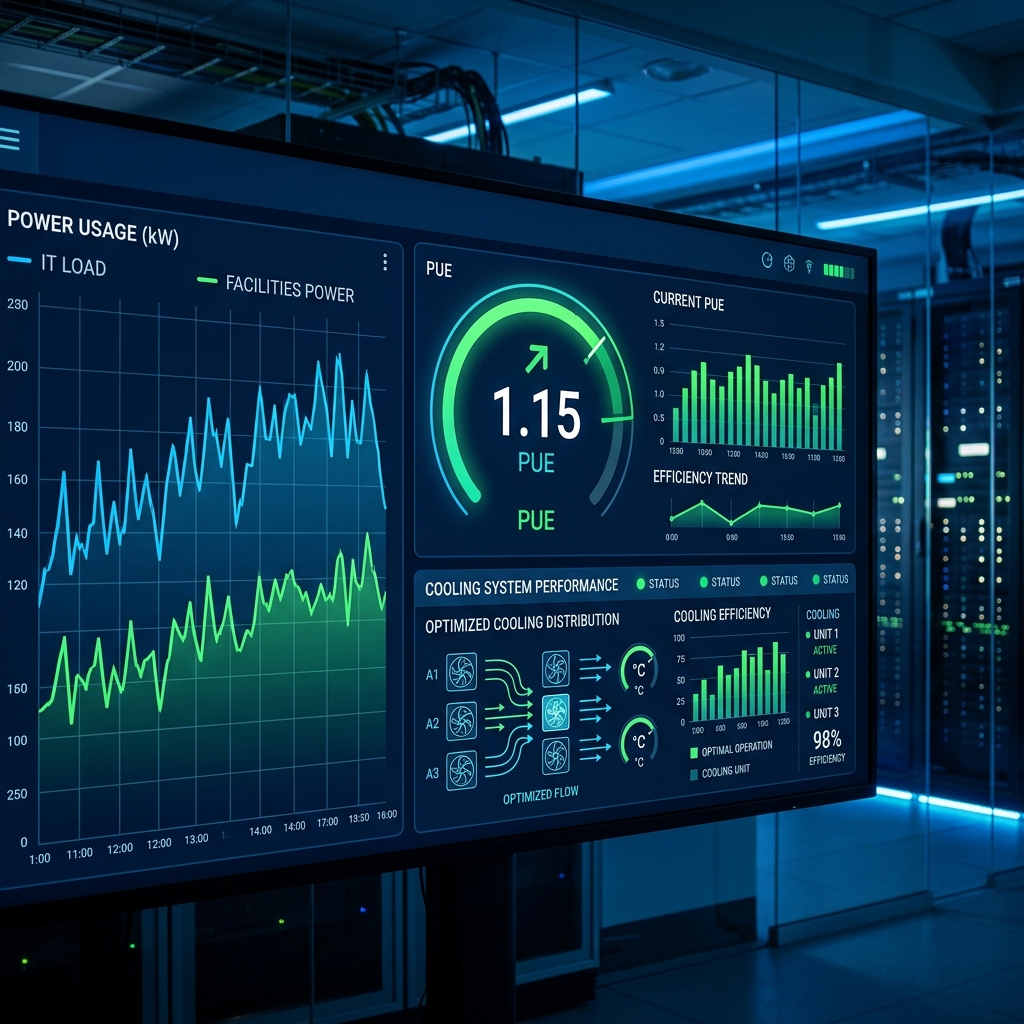
Power Usage Effectiveness (PUE) is the single most important metric for data center operational efficiency. It measures the ratio of total facility power to IT equipment power - a PUE of 1.0 would mean every watt entering the facility is used by IT equipment, with zero overhead. In practice, cooling, lighting, power conversion losses, and building systems all consume power, pushing PUE above 1.0.
The global average PUE for commercial data centers is approximately 1.58. Best-in-class hyperscale facilities achieve 1.06–1.10. Most Indian enterprise data centers operate between 1.6 and 2.0 - meaning they waste 60 to 100% of their IT power load on overhead. This represents enormous financial waste and, increasingly, regulatory risk as ESG reporting requirements tighten.
Why PUE Matters Beyond Energy Bills
The financial impact of poor PUE is straightforward: a 1 MW IT load facility operating at PUE 1.8 consumes 1.8 MW total - 0.8 MW of pure waste. At Indian commercial power rates, this wasted power costs approximately ₹3–5 crore annually. Over a 10-year facility life, the cumulative waste can exceed the original construction cost of the cooling infrastructure.
But PUE also impacts investor confidence, regulatory compliance (particularly as India moves toward mandatory ESG disclosures for large enterprises), and competitive positioning for colocation operators - enterprise customers increasingly include PUE targets in their RFP requirements.
The Five Levers of PUE Improvement
1. Cooling System Optimization (Largest Impact)
Cooling typically accounts for 30–40% of total facility power. The single most impactful PUE improvement comes from addressing cooling inefficiency. Key strategies include: implementing hot aisle/cold aisle containment to prevent air mixing, raising supply air temperature from the traditional 18°C to 25–27°C (ASHRAE A1 allows up to 32°C), deploying variable speed drives on CRAC/CRAH fans and chiller compressors, and implementing free cooling (economisation) wherever climate permits.
2. Free Cooling Potential by Indian Climate Zone
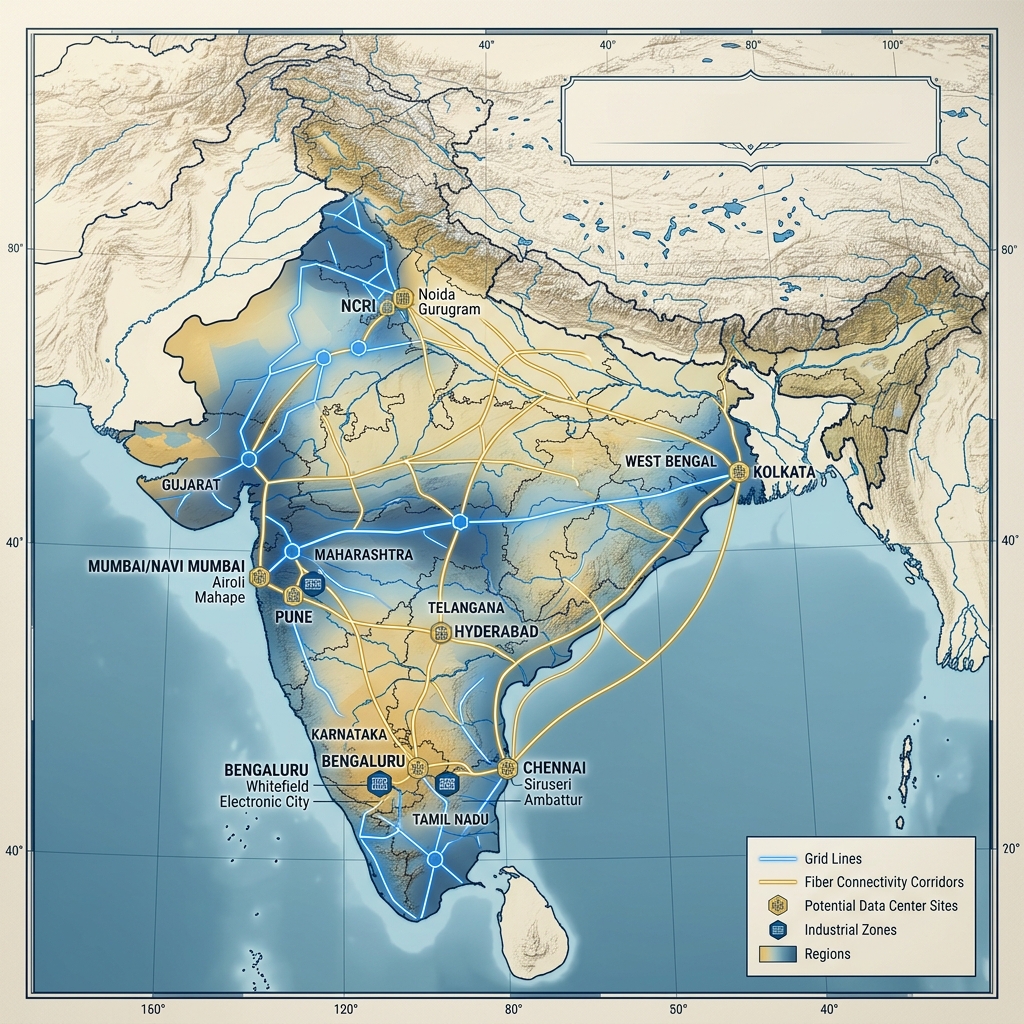
Free cooling - using outside air or water to supplement or replace mechanical cooling - is the most overlooked opportunity in Indian DC operations. While India is perceived as universally hot, the reality is more nuanced. Pune, Bangalore, and Hyderabad offer 3,000–4,500 hours per year where outside air temperature is below 24°C - sufficient for direct or indirect economisation. Even Mumbai and Chennai offer 1,000–2,000 hours of partial free cooling potential during winter months and nighttime. Northern cities like Delhi-NCR offer excellent winter free cooling but require filtration for air quality.
3. Power Distribution Efficiency
Every power conversion step loses energy. Legacy facilities with multiple UPS stages, transformer taps, and PDU conversions can lose 8–15% of input power before it reaches the IT load. Modern approaches include using high-efficiency modular UPS systems (98%+ efficiency), reducing the number of conversion stages, and implementing DC power distribution where feasible for specific workloads.
4. IT Load Optimization
PUE improves when IT load increases relative to overhead - meaning eliminating zombie servers, consolidating underutilised hardware, and increasing virtualisation density directly improve facility PUE without touching the cooling or power infrastructure.
5. Measurement and Monitoring
You cannot improve what you do not measure. Many Indian facilities report PUE based on annual averages, masking seasonal and operational variations. Best practice requires granular, real-time PUE measurement at the PDU level, with separate tracking of cooling, lighting, and power distribution losses.
A Realistic PUE Improvement Roadmap
Phase 1 (Quick Wins, 4–8 weeks): Implement containment, raise supply temperature, eliminate bypass airflow. Expected improvement: 0.2–0.4 PUE points. Phase 2 (Medium-Term, 3–6 months): Deploy variable speed drives, implement free cooling where climate permits, upgrade UPS to high-efficiency units. Expected improvement: 0.1–0.3 additional points. Phase 3 (Long-Term, 6–18 months): Evaluate liquid cooling for high-density zones, implement granular monitoring, consider renewable power integration.
A well-executed PUE optimisation program can move a typical Indian facility from 1.7 to 1.2–1.3 within 12–18 months, with the investment typically paying for itself within 2–3 years through energy cost savings alone.